


KUALA LUMPUR, 3 April (Bernama) — Pihak Berkuasa Pembangunan Tenaga Lestari (SEDA) Malaysia dan Kumpulan Jakel berkongsi kemeriahan Raya Aidilfitri yang bakal tiba bersama Rumah Bakti Nur Syaheerah melalui program ‘Shopping
HIGHLIGHTS
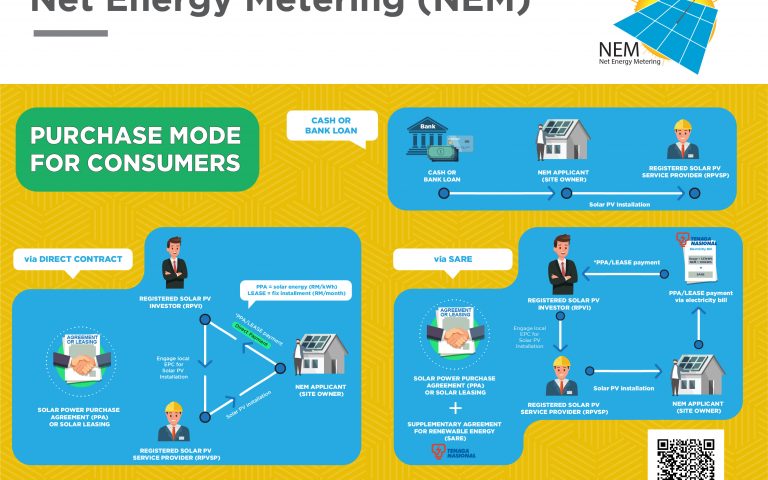
Renewable Energy Programmes
Energy Efficiency
Announcements
Statistics & Monitoring

Job@SEDA


Corporate Social Responsibility
The Green Heroes Contest
Photo Gallery
SEDA News Insights

Govt approves 22 RE projects with total capacity of 36.534 MW
KUALA LUMPUR (Jan 18): The Ministry of Energy Transition and Public Utilities via the Sustainable Energy Development Authority (Seda) has approved the development for the implementation of 22 renewable energy

SEDA komited capai aspirasi negara
KUALA LUMPUR: Timbalan Perdana Menteri Datuk Seri Fadillah Yusof mahu warga Pihak Berkuasa Pembangunan Tenaga Lestari (SEDA) Malaysia terus fokus kepada pelaksanaan kerja yang cekap dan berkualiti untuk memastikan perkhidmatan
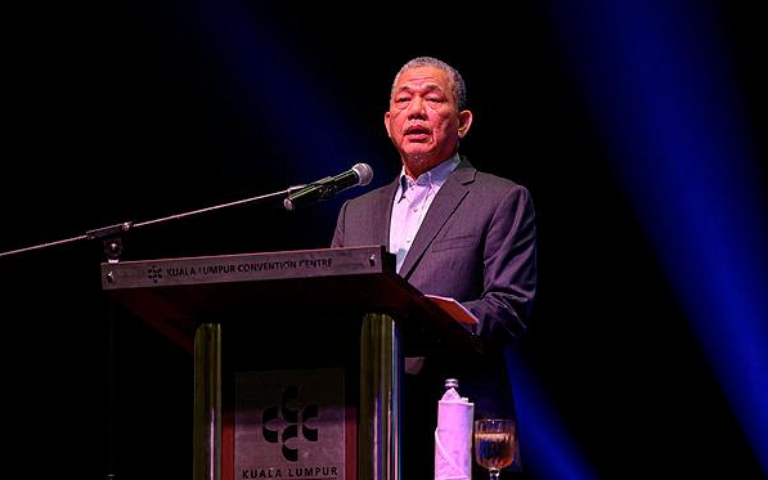
SEDA Malaysia is committed to achieving country’s aspiration
KUALA LUMPUR: Deputy Prime Minister Datuk Seri Fadillah Yusof wants the Sustainable Energy Development Authority (SEDA) of Malaysia to focus on efficient and quality work to ensure that satisfactory services

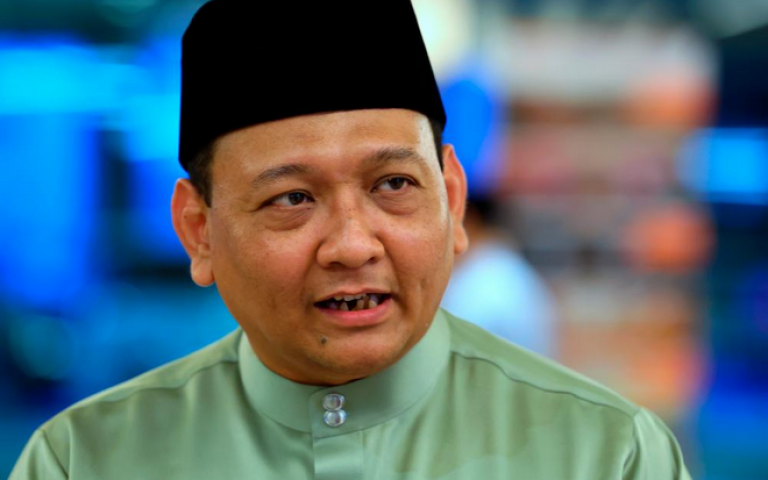
YAB DATO’ SRI FADILLAH MELAWAT PEJABAT SEDA MALAYSIA
PUTRAJAYA, 12 Jan (Bernama) — Yang Amat Berhormat (YAB) Timbalan Perdana Menteri Dato’ Sri Haji Fadillah Haji Yusof telah membuat lawatan kerja ke pejabat Pihak Berkuasa Pembangunan Tenaga Lestari (SEDA) Malaysia
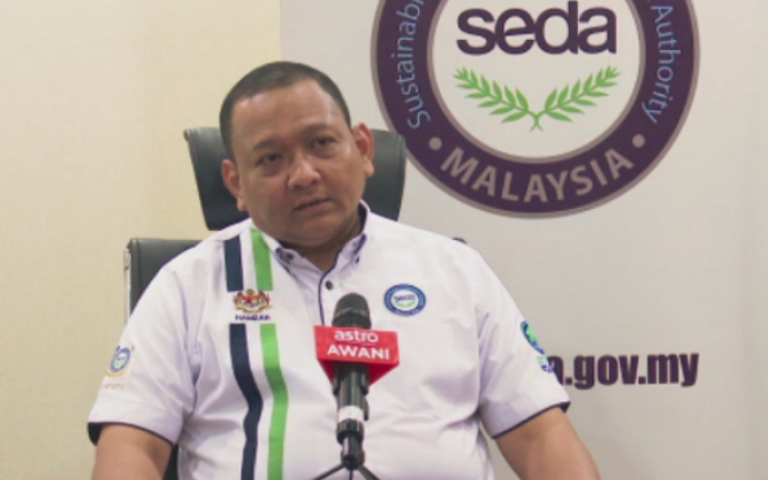
SEDA perkukuh sektor tenaga lestari, pacu ekonomi negara
KUALA LUMPUR: Pihak Berkuasa Pembangunan Tenaga Lestari (SEDA) Malaysia terus komited untuk memperkukuh sektor Tenaga Lestari (TL) dengan tujuan memacu pertumbuhan ekonomi Malaysia serta akan terus menyokong seluruh program dan
SEDA strengthens sustainable energy, drives economic growth
The Sustainable Energy Development Authority (SEDA) Malaysia remains committed to strengthening the sustainable energy sector to drive economic growth. Source: themalaysianreserve

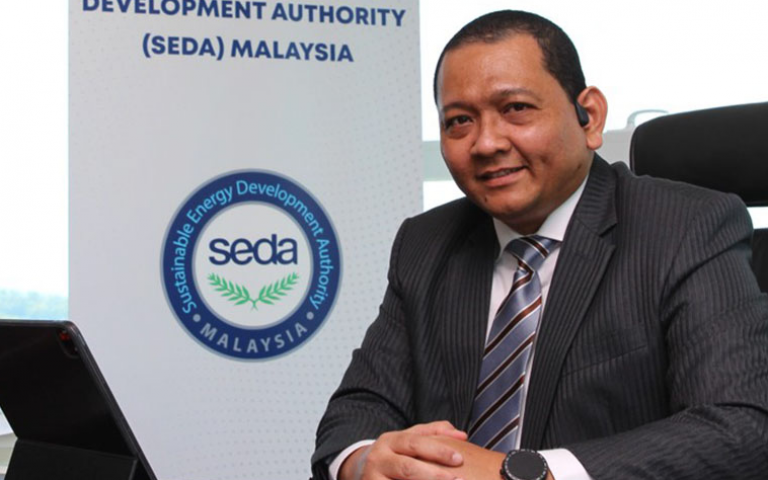
SEDA MALAYSIA ANNOUNCES NEW CHAIRMAN OF THE BOARD
KUALA LUMPUR – Sustainable Energy Development Authority (SEDA) Malaysia has appointed Ahmad Zairin Ismail as its new chairman, effective May 15. In a statement today, SEDA said it is confident
SEDA: Save programme set to continue on back of encouraging demand
PUTRAJAYA: The Sustainability Achieved via Energy Efficiency (Save) programme which provides rebate incentives for the purchase of energy-efficient electrical goods is set to continue for the fourth time, said the